Supermarket Sales Analysis
This project involved creating a comprehensive Power BI dashboard to analyze supermarket sales data from January to March. The dashboard provides valuable insights into sales performance, customer behavior, and identifies key areas for improvement.
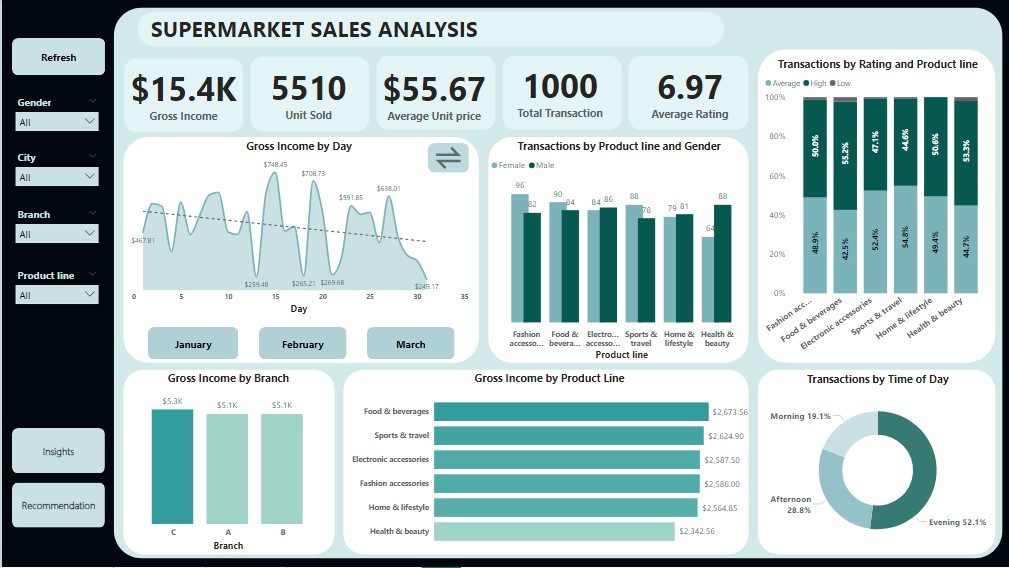
Key Highlights
Sales Overview
- Gross Income: $15.4K generated from 1,000 transactions.
- Units Sold: 5,510 with an average unit price of $55.67.
- Sales Trends: Broken down by day, branch, and product line for deeper insights.
Customer Behavior
- Men completed 499 transactions, contributing $7.4K in gross income.
- Women completed 501 transactions, contributing $8.0K in gross income.
- Evening hours (52.1%) lead transaction volume, identified using a custom DAX column categorizing time into Morning, Afternoon, and Evening.
Insights
- Top Branch: Branch C generates $5.3K in gross income.
- Top Product Lines: Food & Beverages and Sports & Travel outperform others.
Recommendation
- Evening Campaigns: Target evening hours with promotional campaigns to maximize revenue.
- Female Engagement: Focus on strategies to engage female customers, as they contribute more gross income per transaction.
- Inventory Expansion: Increase inventory in high-performing product lines to sustain growth.
Technical Highlights
- Data Cleaning: Renamed columns, removed redundant ones, and ensured accurate data types.
- Dynamic Slicers: Added filters for gender, city, branch, and product line for interactive analysis.
- DAX Functions: Created a custom column to categorize transactions by time of day.
Critical Questions Answered
- Which gender contributes more to gross income and transactions?
- What are the top-performing branches and product lines?
- How do sales vary by time of day and customer demographics?